Standard 10th Science Experiment 7 Answer Solutions: Study of anomalous behaviour of water using Hope’s apparatus Answer Solutions.
Study of anomalous behaviour of water using Hope’s apparatus.
Aim :
To study anomalous behaviour of water using Hope’s apparatus.
Requirements :
Hope’s apparatus, ice, common salt, water, two thermometers, a beaker, a stopwatch (or clock).
Procedure :
(1) Find the least count of the thermometers. (2) Fill the cylindrical container of Hope’s apparatus with the cold water at about 10 °C to 12 °C. (3) Fill the flat bowl of the apparatus with a freezing mixture of ice and common salt. (4) Insert two thermometers in the two holes provided to record the temperature of water in the cylinder atabove and below the flat bowl respectively. (5) Record the temperatures shown by the thermometers after every minute and note the same in theobservation table. (6) Plot the graphs, temperature (T 1) vs time and temperature (T 2) vs time on the same graph paper. (7) Observe the graphs.
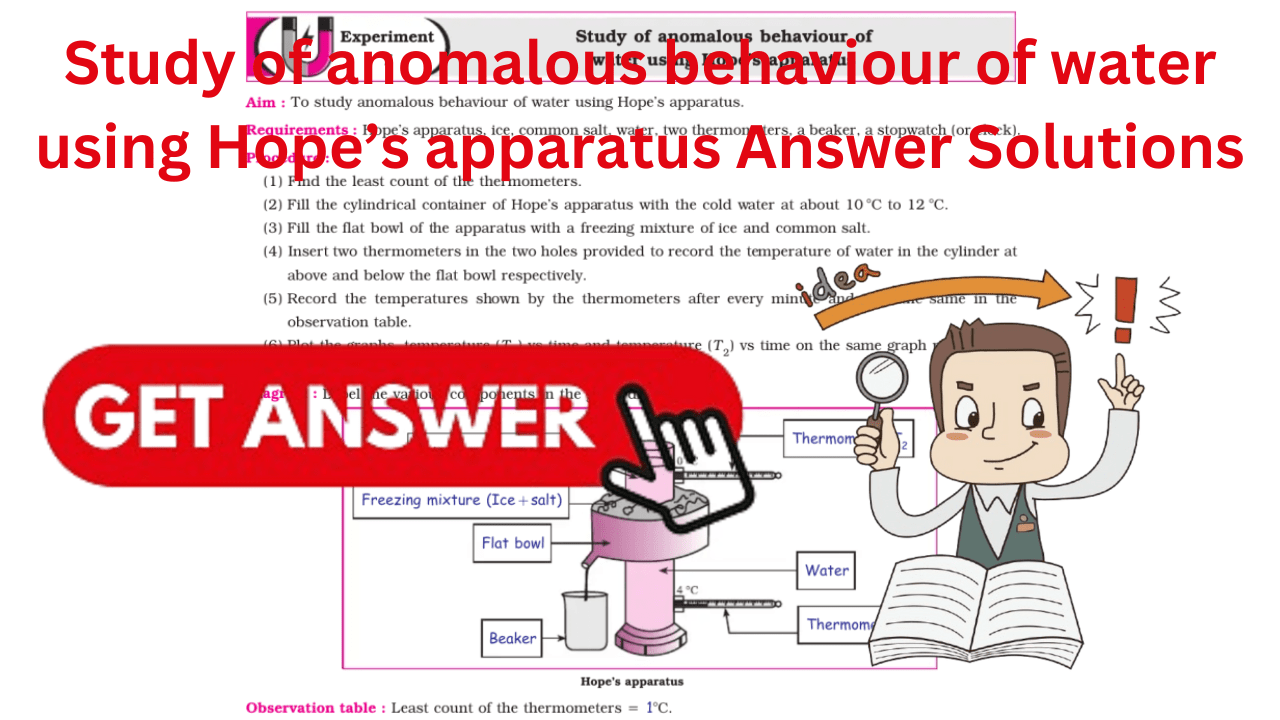
Diagram :
Label the various components in the given diagram.


Inferences / Conclusion with explanation :
(1) Initially, both the thermometers show the same temperature. In a short time, the temperature shown bythe lower thermometer starts decreasing, while the temperature shown by the upper thermometer doesnot change very much.
(2) This process continues till the temperature shown by the lower thermometer falls to 4°C and remains constant thereafter. This shows that in the temperature range 12°C to 4°C, the density of the water inthe central part of the container goes on increasing and hence the water sinks to the bottom. It means that water contracts, i.e., its volume decreases as its temperaturefalls down from 12°C to 4°C.
(3) As the temperature of the water in the central part of the container becomes less than 4°C, the temperature shown by the upper thermometer begins to fall rapidly to 0°C. But the temperature shown by the lower the rmometer remains constant (4°C). Later, the reading shown by the lower thermometer decreasesto 0°C.
(4) In the temperature range 4°C to 0°C, the water moves upward. This shows that the density of water goeson decreasing in this range. It means that waterexpands, i.e. its volume increases as its temperature falls from 4°C to 0°C. The behaviour of water in the temperature range from 4°C to 0°C is called anomalous behaviour of water.
(5) In the graph, the point of intersection of the two curves shows the temperature at which the density of water is maximum. This temperature is 4°C
.
Precaution :
Record all temperatures carefully.
Multiple Choice Questions
Choose the correct alternative and write its letter (A), (B), (C), (D) in the box :
If the temperature of water is increased from 4°C to 10°C, then its .
(A) volume decreases and density increases (B) volume increases and density decreases (C) volume decreases and density decreases (D) volume increases and density increases
Answer: B
2. At 4°C, the density of water is .
(A) 10 g/cm3 (B) 4 g/cm3(C) 4* 103 kg/m3 (D) 1* 103 kg/m3
Answer: D
3. The density of water is maximum at .
(A) 0°C (B) – 4°C (C) 100°C (D) 4°C
Answer: D
4. is used to study the anomalous behaviour of water.
(A) The calorimeter (B) Joule’s apparatus (C) Hope’s apparatus (D) The thermos flask
Answer: C